Heart rate is useful, but it is still a proxy
Heart rate gives you a simple way to see how hard your cardiovascular system is working. That makes it valuable during a run, ride, or conditioning session. It is easy to measure, responds as effort rises, and lets you compare similar sessions over time.
The number on your watch does not directly show what is happening inside the working muscle. Two people at 150 beats per minute can be under very different metabolic strain. Heat, fatigue, hydration, caffeine, medication, altitude, and training history can also change the response.
A heart-rate zone becomes more useful when it is tied to a measured physiological threshold. Without that anchor, a zone calculated from age or a percentage of maximum heart rate is an estimate.
What blood lactate adds
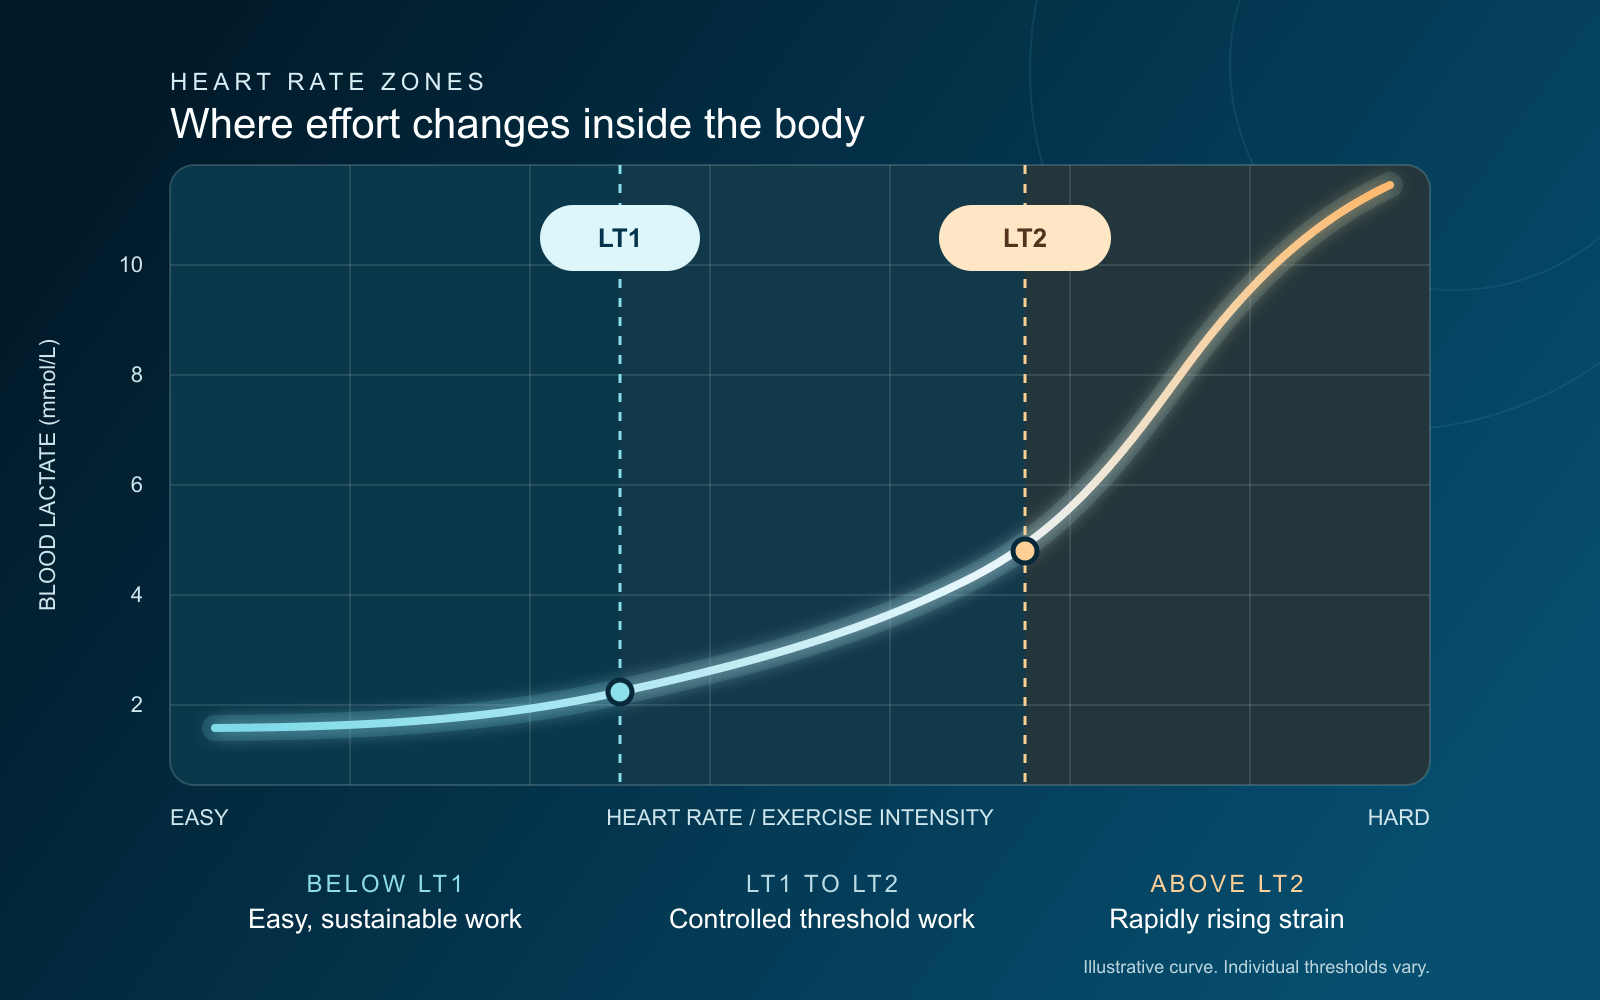
Your muscles produce lactate throughout exercise. At easier intensities, the body can use and clear it at roughly the rate it appears, so blood lactate stays relatively stable. As the workload rises, that balance begins to change. A graded test makes the change visible by pairing each stage of speed or power with heart rate and a small blood sample.
The result is a curve rather than a single pass-or-fail number. Early in the test, lactate remains close to baseline. It then begins to rise and eventually turns upward much faster. Those changes help locate two useful boundaries, usually called the first and second lactate thresholds.
You may see 2 mmol/L used for the first threshold and 4 mmol/L for the second. These are common reference values, not universal cutoffs. The shape of the curve, the testing protocol, and the individual response all matter.
Move through a graded lactate test
This is a conceptual curve for learning, not a prediction of your test result.
LT1 and LT2 in plain language
LT1 marks the first clear, sustained rise above baseline. Below it, long sessions are easier to recover from. LT2 sits near the boundary where lactate accumulation accelerates and the effort becomes much harder to sustain.
Ventilatory testing offers another way to find related transitions. As exercise intensity rises, breathing changes in response to the body’s increasing need to regulate carbon dioxide and acid-base balance. The first and second ventilatory thresholds often track the same broad intensity transitions as LT1 and LT2, although the measurements are not interchangeable in every person or test.
| Boundary | What changes | How the effort tends to feel | Training use |
|---|---|---|---|
| Below LT1 | Lactate stays near baseline | Easy and sustainable | Recovery and aerobic volume |
| LT1 | Lactate begins a sustained rise above baseline | Controlled, with steady breathing | Upper boundary for genuinely easy work |
| Between LT1 and LT2 | Lactate is elevated but may remain relatively stable | Focused, steady work | Tempo and threshold development |
| LT2 | Lactate begins accumulating much faster | Hard and time-limited | Upper threshold work |
| Above LT2 | A metabolic steady state cannot be maintained for long | Very hard | High-intensity intervals and VO₂-focused work |
Three zones or five? Both can work
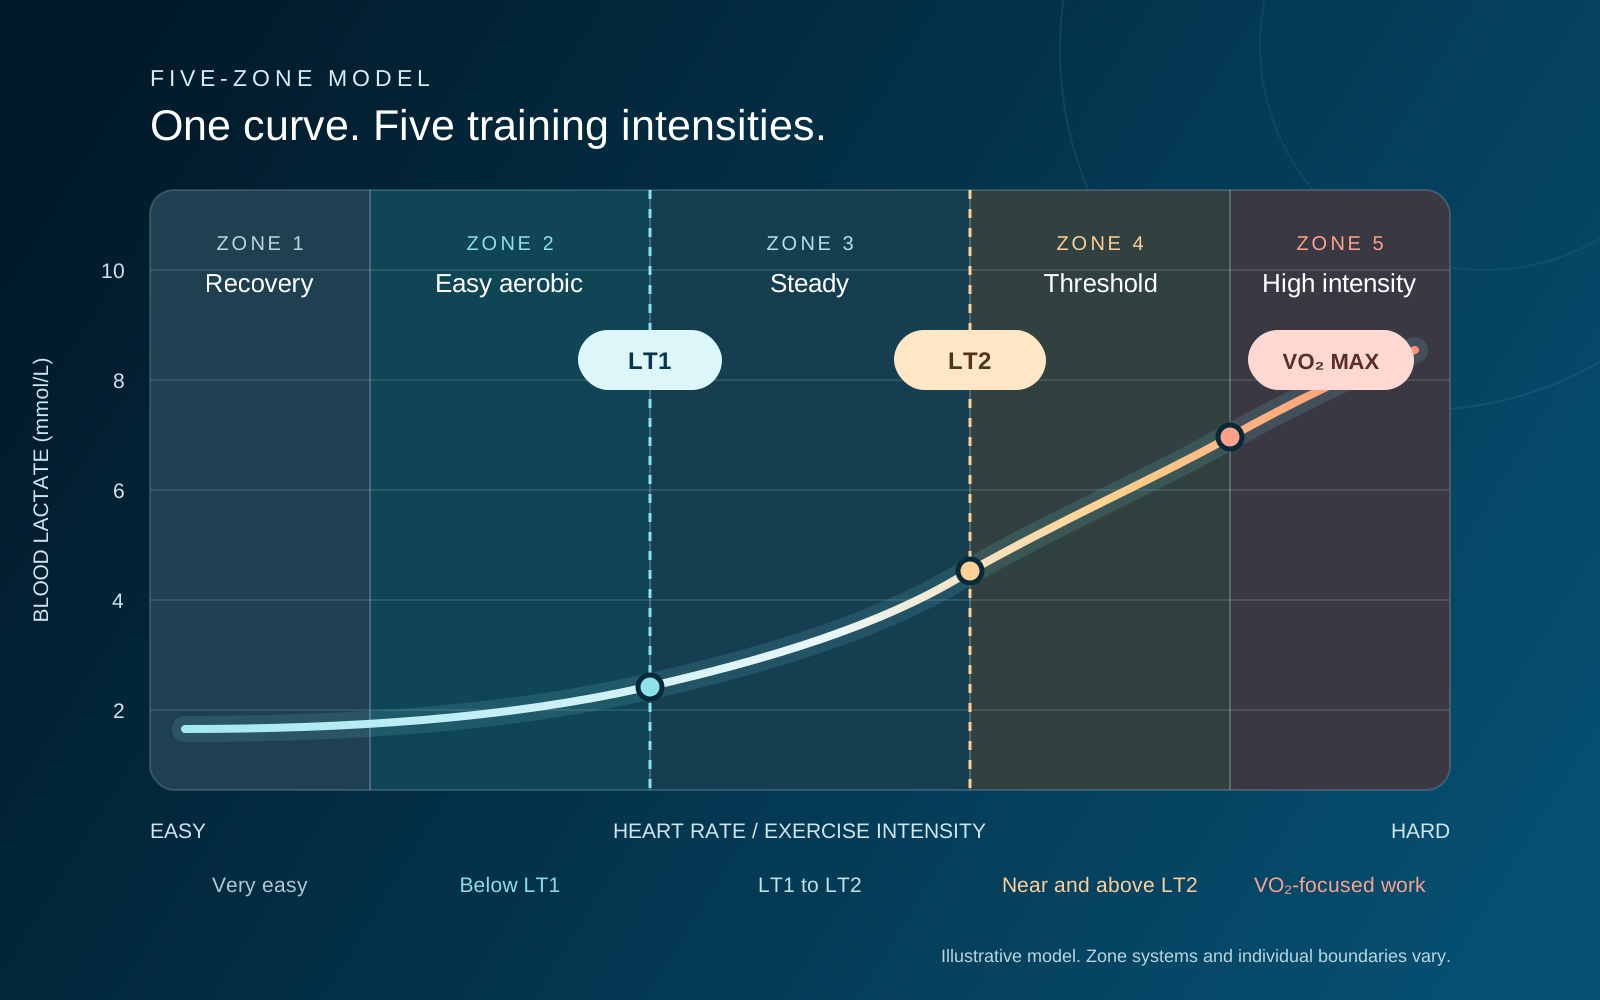
A three-zone model follows the physiology directly: below LT1, between LT1 and LT2, and above LT2. It is simple and useful when you want to describe easy, threshold, and high-intensity work.
A five-zone model adds more prescription detail inside those ranges. Coaches and wearables do not all divide the five zones in the same way, so a Zone 2 session in one app may not match Zone 2 somewhere else. The label matters less than the boundary used to set it.
Generic percentages can mislead. Research comparing common intensity prescriptions has found wide individual variation in where physiological thresholds fall relative to maximum heart rate or heart-rate reserve. A neat formula can still give you the wrong session.
Estimate five heart-rate zones
This uses the age-predicted 208 − 0.7 × age formula and heart-rate reserve. Treat the result as an estimate until testing gives you measured boundaries.
Estimated maximum: 184 bpm
Medication, heat, hydration, altitude, fatigue, and individual physiology can move these ranges. This tool does not locate LT1 or LT2.
How to find your own thresholds
A laboratory or supervised field test gives the clearest answer. During a graded test, speed or power increases in stages while heart rate is recorded. Blood lactate can be sampled from a fingertip or earlobe at the end of each stage. A cardiopulmonary exercise test can also measure breathing and oxygen use to identify ventilatory thresholds and VO₂ max.
A hard 30-minute field effort can provide a rough estimate of threshold heart rate. The average heart rate from the final 20 minutes is commonly used as a practical starting point. It does not locate both lactate thresholds, and pacing, terrain, weather, fatigue, and motivation can move the result.
Wearable estimates are convenient for tracking a trend. Treat them as estimates until they have been compared with a proper test and with how you respond in training.
Would better zone data help?
This is a planning prompt, not a diagnosis or validated assessment.
VO₂ max and lactate threshold answer different questions
VO₂ max describes the highest rate at which your body can take in and use oxygen during hard exercise. Threshold testing shows how much of that aerobic capacity you can sustain before the internal cost rises sharply.
Both measurements matter, along with movement economy and how quickly oxygen use responds when the workload changes. Training can improve these qualities, which is why the same heart rate may eventually support a faster pace or more power.
What lactate-guided training can do
Lactate can also guide the session itself. A 2023 review described a model used by some world-class distance runners in which blood lactate is checked during threshold intervals. The target reflects internal strain rather than pace alone, allowing the athlete to adjust when conditions or readiness change.
The model combines a very high volume of easy running with several threshold sessions and one VO₂ max session each week. It was developed around elite runners who may cover 150 to 180 kilometres per week. That workload should not be copied out of context. For most readers, the practical lesson is to measure internal strain and adjust the external workload to match it.
Three example sessions
01Easy aerobic
Keep breathing controlled and finish able to do more.
02Threshold
Hold an even internal strain instead of chasing the fastest opening rep.
03VO₂-focused
Use only when the rest of the week leaves room to recover.
Examples assume a healthy, trained adult. Adjust exercise mode, volume, and intensity to the person.
How Optimability uses the result
A threshold test is valuable when it changes the plan. We use the result to set training intensity around the person. The plan can then account for recent training, sleep, recovery, travel, schedule, and the goal of the current block.
Good zones reduce guesswork without turning every workout into a data project. Easy work stays easy enough to recover from, threshold work lands near the intended strain, and hard sessions have a clear reason for being there.
Retesting shows whether the curve has moved. A stronger athlete may run faster or produce more power at LT1 and LT2 even when the heart-rate number changes very little. That is progress a watch score can miss.
Common questions
It depends on the zone system. In a five-zone model built from measured thresholds, Zone 2 usually sits below or near LT1. A wearable may use a different calculation, so check how its boundaries are defined.
No. Four mmol/L is a common fixed reference for a second threshold, but the value at an individual threshold varies. A tester should interpret the full curve and protocol instead of forcing every person onto one number.
A watch can estimate threshold from pace, power, and heart-rate patterns. It does not measure blood lactate. The estimate can be useful for tracking, especially when compared with a laboratory or field test.
Retest when the answer could change the next training block. The timing depends on training age, program length, goals, and whether recent data suggest that the old zones no longer match the response.